Last week I went down a bit of a rabbit hole trying to figure out how many states shared CARES Act funds with local governments. The short answer is, I’m still not sure and this post is about my attempt to figure it out.
What’s the CARES Act Program Again?
As a quick refresher, the Coronavirus Relief Fund (CRF) was created as part of the Coronavirus Aid, Relief, and Economic Security (CARES) Act, and allocates $150 billion in multi-purpose, somewhat flexible aid to states, Tribal governments, U.S. Territories, D.C., and a small number of counties and cities (read more here and here). Governments that directly received money are referred to as “prime recipients.” In total state governments got $111.37 billion.
Every state received a minimum of $1.25 billion (less any amount that went directly to cities or counties), and distribution of the money was done based on population. The Kansas state government, for example, got $1.034 billion, while California received $9.5 billion. State leaders have broad latitude in deciding how to spend the money, so long as spending is tied to the COVID-19 emergency (including economic effects). Governments have until December 31, 2021 to use the money (originally the deadline was December 30, 2020).
While all state governments received CRF funds, only cities and counties with populations of at least 500,000 did. This meant out of the nearly 40,000 local, general-purpose governments in the U.S. only 154 were guaranteed CRF funds. State governments were encouraged–but not required–to share a portion of their CRF allocation with local governments. So I wanted to know: 1) How many states shared money with local governments? 2) What portion of their CRF funds did they share with local governments?
As with many things, I thought these would be straightforward, simple things to figure out….and it was not.
Who is Tracking How States are Using the CRF Money?
The Treasury Department was tasked with administering the CRF program, as well as the larger Coronavirus State And Local Fiscal Recovery Funds program (created as part of the American Rescue Plan Act). Importantly, the CRF program is brand new, so there was no pre-existing infrastructure for it, and Treasury’s guidelines for it evolved over time.
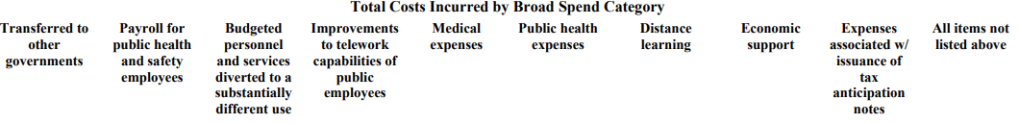
All governments have to report their spending to Treasury, and the Treasury Office of Inspector General (OIG) is specifically “responsible for monitoring and oversight of the receipt, disbursement, and use of Coronavirus Relief Fund payments.” In July 2020, government had to report all CRF expenses incurred between March 1 and June 30, 2020, and expenses incurred by then were reported using 10 broad categories, shown below.
By June 30, 2020, state governments had spent about 25% (or $27.24 billion) of their CRF funds. At that time 25 states reported transferring some amount of money ($7.18 billion in total) to other governments. The interim report captured only what states had spent by June 30, 2020, and didn’t include planned spending. In other words, it’s an incomplete picture.
What Have Governments Spent Since June 2020?
After that interim report, governments had to submit their spending on a quarterly basis via a newly developed portal in the GrantSolutions management system. The spending data that has been collected thus far, which is as of June 2021, is readily available on the Pandemic Oversight site.
If more recent spending data is available why I can’t I figure out my two questions (how many states shared money, and how much money did they share)? That has to do with how the information is captured and organized.
One issue is that the information is reported and organized using the “prime recipient” agency/department name that is charge of the state or cities’ spending–as examples, in the dataset the recipient name for the State of Illinois is “Emergency Management Agency, Illinois” and it’s “Executive Office State Ohio” for Ohio. The dataset is capturing spending from all governments that directly received CRF funds. In total there are 756 governments that are prime recipients in the dataset. Unfortunately there is not a variable for government type (state vs. Tribal vs. Territory), so I’m cleaning the names and creating a government type variable to isolate just state spending.
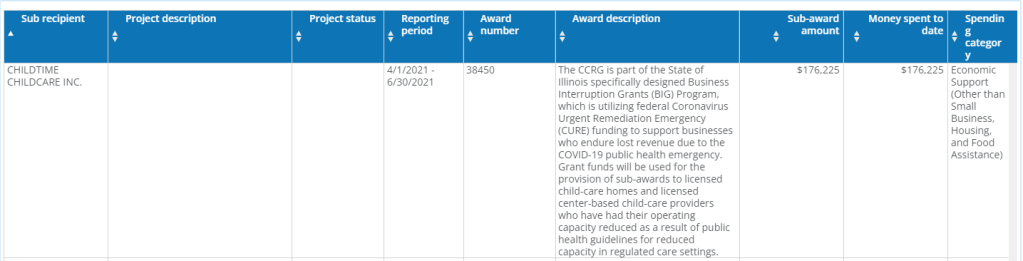
The second issue is that the broad categories from the interim report aren’t included. Instead, spending is captured at a more granular level. Within the dataset there are several variables that describe the spending: a) sub-recipient, which is the agency, non-profit, business, etc the government is paying for the service or program; b) project description; c) award description; and d) spending category, but while there were just 10 categories in the interim report there are 5,471 unique categories in the Pandemic Oversight dataset. And items b-d aren’t populated for every entry. Below is an example of one entry for the State of Illinois–this example is $176,225 business interruption grant awarded to Childtime Childcare Inc. for economic support.
Cleaning up the dataset so I can figure out how much money states shared with local governments will take considerable time. For the State of Illinois, there are 5,822 entries in the dataset, and I can possibly isolate spending that’s just a transfer to a local government using the sub-recipient name. I’d need to do this for every state though. The dataset has a lot of information and the Pandemic Oversight website is created so you can query and track spending down to the project level. While that’s a positive, the negative is I don’t think it was created with researchers in mind, hence I can’t easily figure out the answers to my questions.
